Tutorial
gr1 and gr2 are GRanges objects
gr1 %^% gr2
gives a length(gr1) logical vector with values of TRUE or FALSE. TRUE if gr1 intersects some interval in gr2, FALSE otherwise.
gr1 %*% gr2
gives a length n ( where n <= length(gr1)*length(gr2)) of all pairwise overlaps of gr1 and gr2 with merged meta.data
gr1 %$% gr2
returns length(gr1) GRanges aggregating all metadata values of gr2 within gr1, taking mean if the meta data item is numeric and concatenating the value if it is a string
gr1 %Q% (expression)
subsets gr1 using indices or logical values resulting from expression
gr1 %Q% (gene== “EGFR”)
will return the subset of gr1 entries for whose metadata column $gene has “EGFR”
library(gTrack)
library(gUtils)
## tutorial on using the above operations
## set current working directory to the folder where the OSMIC TSV was saved in.
setwd("~/Downloads")
## load the load. Need to download cosmic data set - http://cancer.sanger.ac.uk/census
COSMICgenes <- read.delim("cosmicdata.tsv")
## save the gene symbols into a factor
geneSymbols <- COSMICgenes[,1]
## loading gene definitions which we can use to plot windows (GRanges)
genes = readRDS('files/genes.rds')
## this loads coverage data from cancer cell line (GRanges object, have to make it into a gTrack)
cov = readRDS('files/coverage.rds')
## loading the GENCODE gene model gTrack
gt.ge = track.gencode()
# subset genes to just the genes in the COSMIC dataset
genez <- genes %Q%(gene_name==geneSymbols[1])
# subset the rest of the genes
for (i in 2:length(geneSymbols)) {genez <- c( genes %Q% (gene_name==geneSymbols[i]) , genez)}
# add the average coverage metadata column for each gene
genez <- genez %$% cov
gt.cov = gTrack(genezz , y.field = 'mean' , circles = TRUE , col = 'blue' , name = 'Cov')
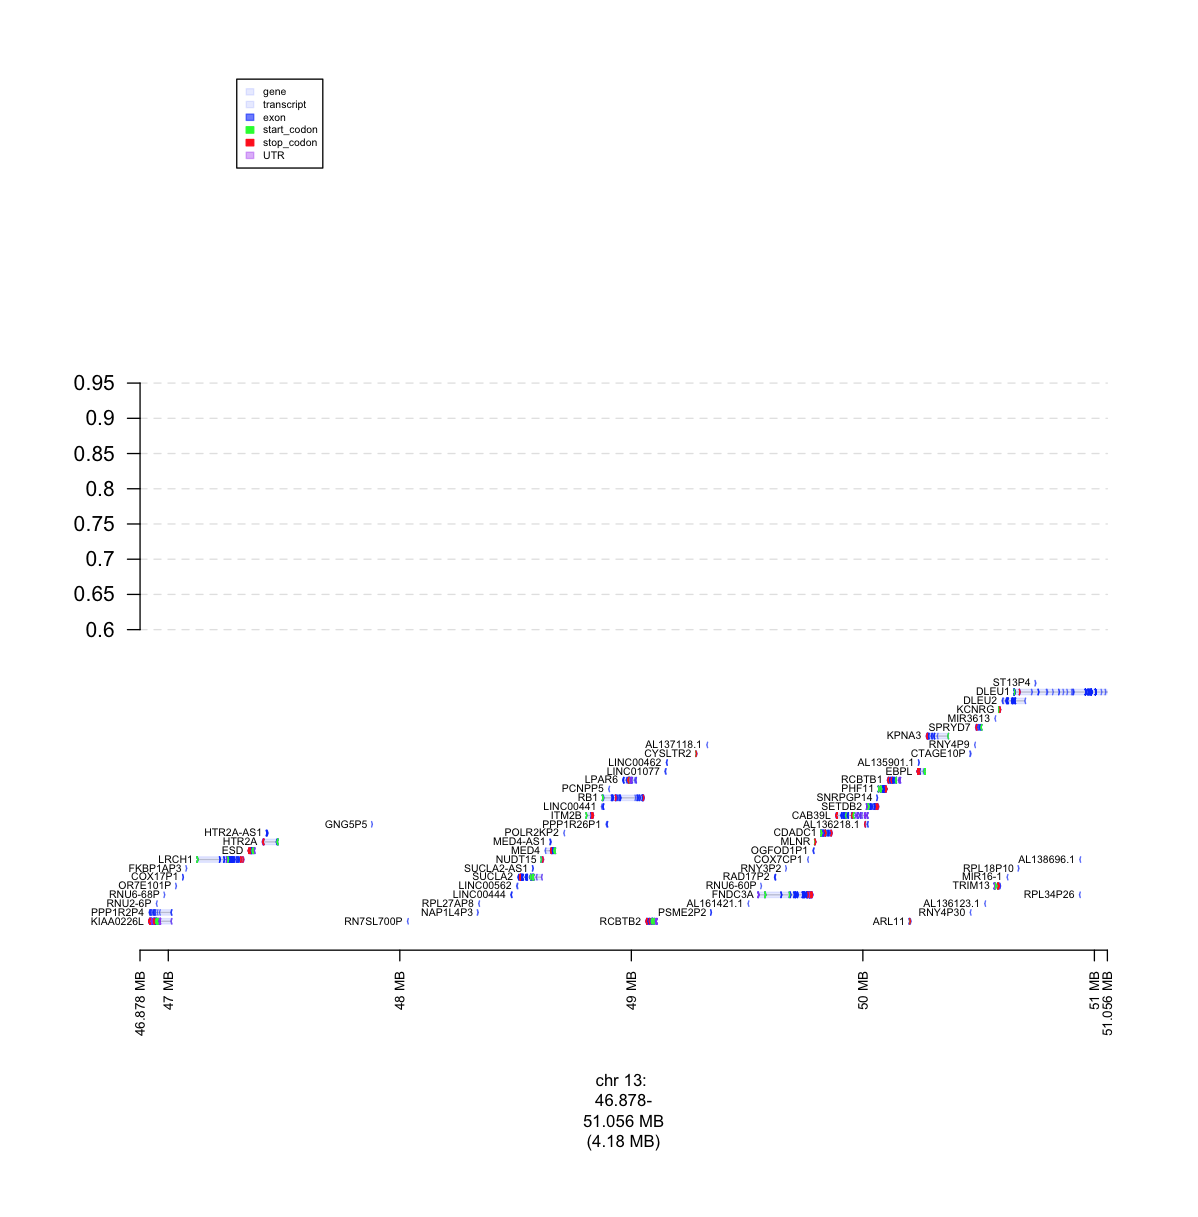
# set window for plot -RB1 gene and genes around it in a 2e6 range
window = genez[genez$gene_name == "RB1"] + 2e6
plot(c(gt.ge , gt.cov) , window)